Research restaurants Leeuwarden
Published by  Sanne Klein
— 6 years ago
Sanne Klein
— 6 years ago
Blog: Leeuwarden, Friesland, The NetherlandsTags: Erasmus blog Leeuwarden,
Leeuwarden,
Netherlands
For a school assignment of Stenden, me and a group of students have completed this research of different restaurants in Leeuwarden.
Restaurant Staff Quality Dimensions in the Restaurant Service Industry in Leeuwarden
Abstract
The mail goal of this research is to discover what the level of staff quality of restaurant in Leeuwarden is. Field research has been carried out at the service restaurant de Lachende Koe. Next to that desk research has been done by studying literature reviews related to staff quality. After field- and desk research, the observations concluded that every dimension mentioned in this research has a positive influence on the overall satisfaction. According to the field- and desk research overall satisfaction has the strongest relation with knowledge of the staff. Next to that the study found that the staff quality of service oriented in Leeuwarden was good.
Reason and purpose of the study
The Hospitality industry is one of the most competitive industries in the world. This industry includes restaurants, hotels, cafes, bars and other facilities that focus on customer satisfaction through high quality service and by providing unique experience for a guest. The biggest competition in this industry can be felt among restaurants. According to Cohen (1997), the factor that distinguishes restaurants that “come and go,” from those that “come and stay” is that those restaurants that stay have greater abilities in “delighting their customers.” There are various kinds of challenges that restaurants have to deal every day in order to be on a higher step among the competitors. This research is going to be mostly focused on staff quality characteristics. Staff quality entails gaining profit through service, knowledge about the product and desire to successfully make a customer satisfied by the service that he would be willing to come back later. The factors to differ from other restaurants include: food quality, dining experience, speed of service, service quality and other aspects. These aspects can be influenced through customer contact and personnel. Therefore the problem statement of this research is: What is the level of staff quality in restaurants in Leeuwarden?
Overall Satisfaction
Overall satisfaction is based on three different types of needs and on own and other’s experiences. The three different needs consist of psychological, intellectual and social needs, according to Scitofsky (1985) (as cited in Andersson & Mossberg, 2004). Psychological needs are the biological needs and desires, which entails for example food, drinks, heating, health and sex. Intellectual needs are the needs are based on personal interests, excitement and entertainment, examples of intellectual needs are music, arts and literature. Social needs contains the desire of people of social belongings to groups and partly self-esteem related to rankings within that group. Membership, titles and status are examples of social needs.
Next to needs, Parasuram, Zeithaml and Berry’s study (as cited in Singh, 2015) shows satisfaction is defined by own and other their experiences. The experiences of others can be distributed by word of mouth communication.
Service times/rapidness
One of the most important aspects of guest satisfaction is the service times (Tobin & Huffman, 2006). The expectation of the service time and the real perception is also crucial when talking about customer satisfaction, according to Berry, Seiders & Grewal (as cited in Tobin & Huffman, 2006). It determines whether the guest is satisfied, dissatisfied or the wow-effect. Quality service, and linked to that fast service, is one of the tools to distinguish a company (Allen, as cited in Tobin & Huffman, 2006). Therefor restaurants should try to improve their service times as much as possible.
The service time needs to be minimal to gain higher customer satisfaction. The study of Ruggless (as cited in Tobin & Huffman, 2006) concludes that the service times can be improved by proper use of technology.
The study of Tobin & Huffman (2006) also states different ways to measure the rapidness of the service. These measurements include the arrival greet time, seated greet time, beverage service time, entrée order time, check back time, payment time and the table turns.
The greet time includes the time the guest waits to be greeted by the staff members. Normally this time should be immediately, less than 15 seconds.
Seated greet time is defined as the time the guest waits to be greeted by the waiter after being seated at their table. The standard for the seated greet time is 30 seconds.
The beverage service time is the time the guests waits between ordering a beverage and receiving it, this should not be more than 3 minutes.
The time a guest has to wait between ordering food and receiving their food is known as entrée order time. At lunch this time should maximal take 12 minutes, at dinner 15 minutes.
The check back time is the time between when the food is served and when the waiter comes to check on the guests again, to see if everything is alright. This time should not be more than 5 minutes.
Payment time is stated as the time the guest has to wait between paying and the waiter changing the received cash. It should not take more than 3 minutes, guests are often eager to leave, and therefore it should not take much time.
The time a guests occupies a table is called the table turn time, the average is around 53 minutes for each guest visit.
Attitude
Next to the speed level of the staff, the attitude is also of importance when it comes to customer satisfaction. According to Saxe and Weitz (as cited in Pettijohn, Pettijohn & Taylor, 2004), a salesperson must have necessary skills which are useful to engage with customers. These skills of the employees may include, listening skills, customer oriented view, overall skills, honesty, communication skills and knowledge. Kaydo (as cited in Pettijohn, Pettijohn & Taylor, 2004) states customers wants salespersons that are honest, knowledgeable, willing to help find the best solution and who are good communicators. Guests appreciate this and their satisfaction level will increase. Next to this the staff should also have good listening skills, (Pettijohn, Pettijohn, Taylor, 2004). When the guest e.g. has a complaint or a remark, the staff should be able to adapt and deal with this.
Dwyer, Hill and Martin’s study (as cited in Pettijohn, Pettijohn & Taylor, 2004) has shown that when employees possess these different skills, they will be more customer oriented and proactive. Other research by Grewal & Sharma (as cited in Pettijohn, Pettijohn & Taylor, 2004) has indicated that when companies invest in trainings for their staff related to a more customer oriented view, the employees are more capable of providing major levels of guest satisfaction.
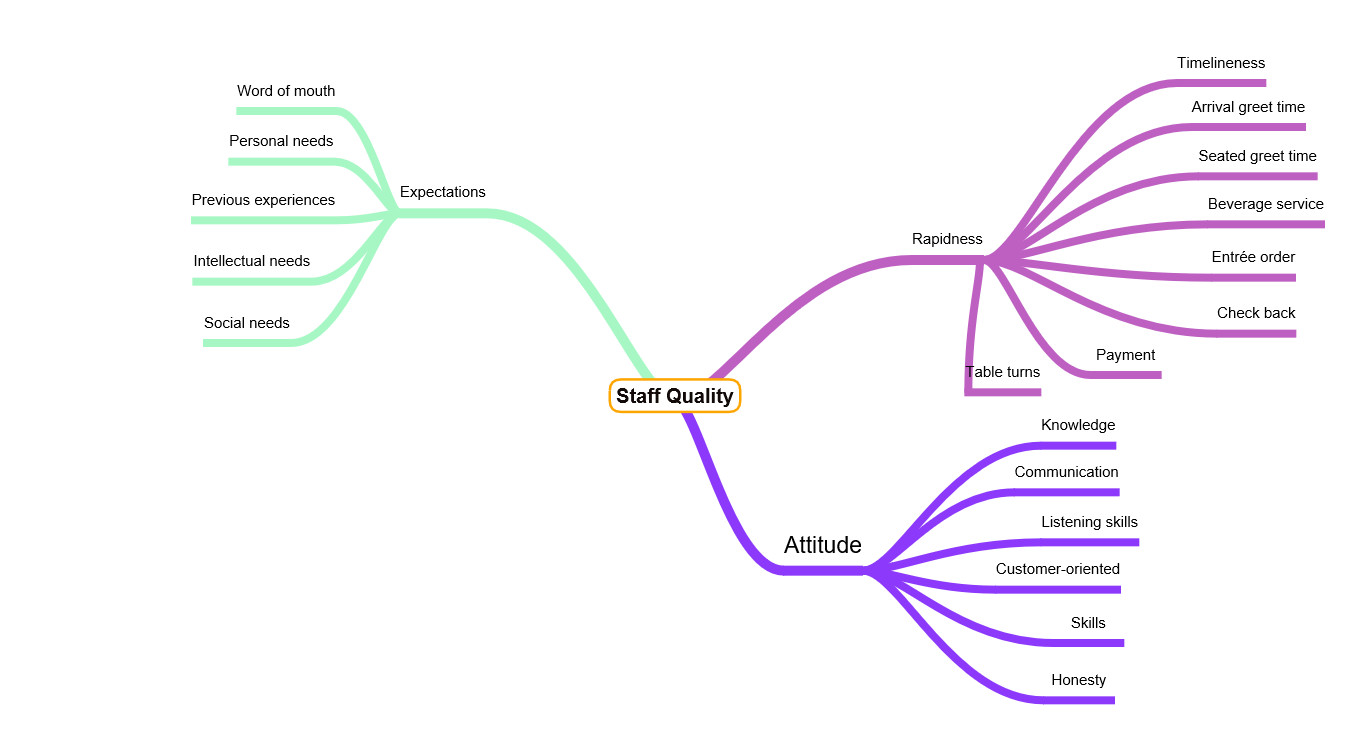
Conceptual Model
A conceptual model has been created on the literature reviews from above, this model has been added in the pictures.
Problem statement and research questions
The problem statement of this report is “What is the level of staff quality in restaurants in Leeuwarden?”
The research questions are defined as:
1. How was the overall satisfaction rated?
2. What was the attitude like in the restaurants in Leeuwarden?
3. How was the service in general rated in restaurants in Leeuwarden?
4. Which dimension of staff quality has the strongest relation or influence on overall satisfaction?
Method
Population and sample
As explained in the introduction this report focusses on staff quality in service oriented restaurants in Leeuwarden, this does not include fast food restaurants for example. The total population of service oriented restaurants in Leeuwarden is 90, according to Tripadvisor.
The sample taken for this research is stated at 7, this includes de Lachende Koe, Fire café, Tao, Pannenkoekenschip, Fellini’s, Maurits huis and Double B.
Instrument
The instrument composed for this research is an observation checklist. Based on theory about staff quality the instrument was developed. The Likert scale has been put in grades from 1 (really poor) till 10 (excellent). The instrument was taken to the restaurants chosen by the groups, where the groups filled in the instrument individual. Some observation elements included, professionalism, honesty, knowledge and manners, as can be viewed in appendix A.
Data collection
The starting point of the data collection was to choose an restaurant the groups wanted to observe. Different restaurants were chosen by each group. After the selection procedure the groups all went out for dinner at their desired restaurant. The staff quality, atmosphere, service, times and the skills of the staff were observed by the groups. After that each group member filled in the questionnaire individually. The complete checklist was sent to the data manager. After that all the data was entered in excel. This was the last step before the data file was complete.
Results
Overall satisfaction
Overall satisfaction is related to many factors, which includes music. The table below shows the mode, median, mean and standard deviation of both. When viewing the table, the overall satisfaction has the highest mode, a 9, while music is ranked at an 8. The median is the same for both aspects. The mean for overall satisfaction is again higher for overall satisfaction then for the music. However the standard deviation for music is higher than the standard deviation for overall satisfaction. This means that the grades given for music were more spread over the Likert scale.
Mode (Mo), Median (Me), Mean (M) & Standard Deviation (SD), of grades of overall satisfaction and music of 7 restaurants.
Variable
Mo
Me
M
SD
Overall satisfaction
9
7
7,07
1,82
Music
8
7
6,33
2,64
Service times
As described in the introduction, service times influence the overall satisfaction of guests. The outcome of the checklist regarding to service times has been put in the table below.
As can be viewed the highest mode obtained is a 10 for the waiting time for being seated, the lowest mode is ranked at 6 for the waiting time for the main course. The median is overall quite the same, ranked at a 7 or 8. The mean is at highest a 8,07 and at lowest a 6,33.
The relative big SD, higher than 1 shows that all of the groups do not really agree on which grades to give.
Mode (Mo), Median (Me), Mean (M) & Standard Deviation (SD), of grades of overall satisfaction, service times in general and specified service times of 7 restaurants.
Variable
Mo
Me
M
SD
Overall satisfaction
9
7
7,07
1,82
Service times in general
7
7
7,67
1,35
Waiting time for being welcomed
8
7
6,33
2,50
Waiting time for main course
6
7
7,40
1,68
Waiting times for beverages
9
8
8,07
1,58
Waiting time for being seated
10
8
7,43
2,21
Waiting time for receiving bill
8
7
7,00
1,77
Waiting time for check-back time
7
7
7,33
1,11
Attitude
Attitude of staff is related to honesty, responsiveness, manners of the staff, overall skills, serving skills, communication skills and listening skills. These factors affect the overall satisfaction, since it affects the guests preservation of their visit. Table 3 shows the mode, median, mean and standard deviation of overall satisfaction and all the subtopics of attitude. The highest mode is again the mode of overall satisfaction, a 9, while the lowest mode is a 7, which appears in manners of staff, overall skills, communication skills and listening skills. The mean is overall quit the same, a 7, however the mean of honesty is a 7,5. The mean at lowest is a 6,53, for responsiveness and manners of staff. The highest mean is a 7,36 for listening skills. The standard deviation is overall quit high, above 1, which means that students did not agree on which grade to give, the grades are spread over the Likert scale.
Mode (Mo), Median (Me), Mean (M) & Standard Deviation (SD), of grades of overall satisfaction, attitude in general and skills of 7 restaurants.
Variable
Mo
Me
M
SD
Overall satisfaction
9
7
7,07
1,82
Honesty
8
7,5
7,00
1,47
Responsiveness
8
7
6,53
2,03
Manners of staff
7
7
6,53
1,68
Overall skills
7
7
6,93
1,33
Serving skills
8
7
7,13
1,41
Communication skills
7
7
6,60
2,35
Listening skills
7
7
7,36
1,15
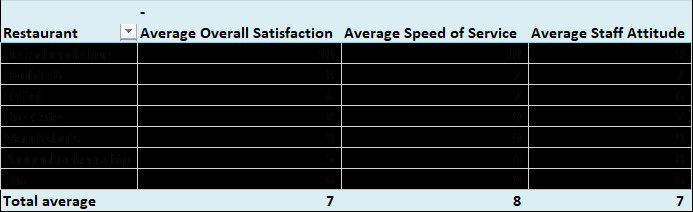
Pivot table showing averages for all dimensions of all restaurants
Table 4 shows the average grades given on the sub dimensions. The overall satisfaction was graded the highest at de Lachende Koe, with a 10. The lowest overall satisfaction was experienced at the Pannenkoekenschip, the grade given was a 5. The speed of service in de Lachende Koe was the highest, a 10, while Pannenkoekenschip had the lowest speed of service, graded at a 6. The staff attitude at highest got a 9, the grade was given for de Lachende Koe and Mauritshuis. The lowest grade for staff attitude was a 6, given to Fellini and Tao. The averages in total were a 7 or an 8.
Relationships between overall satisfaction and sub dimensions
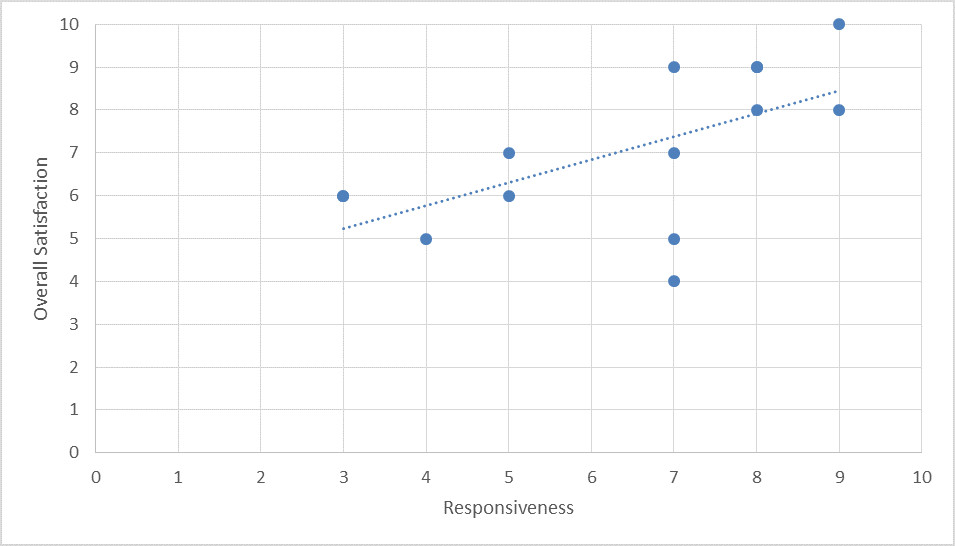
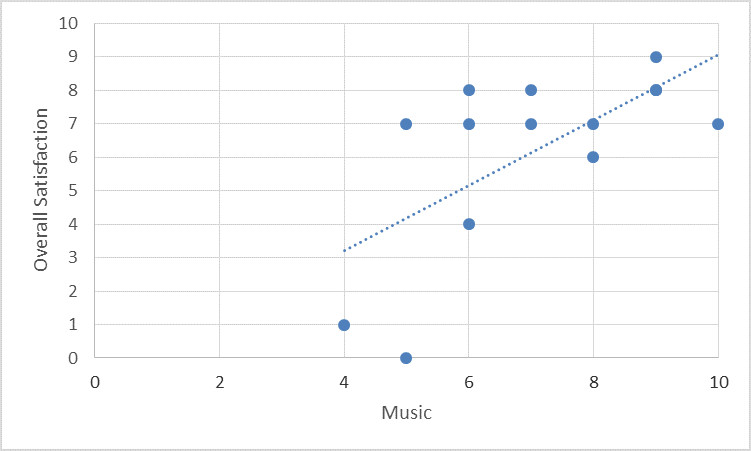
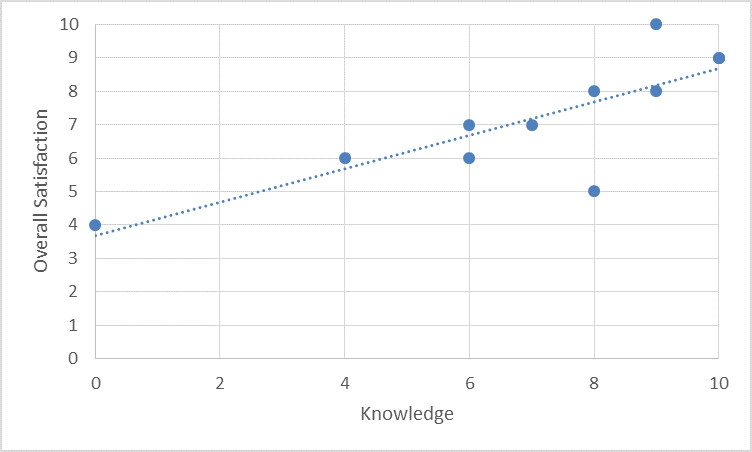
As shown in figure 2, overall satisfaction has the strongest relation with knowledge. This line has the strongest positive progressing route of all scatterplots made, this is shown by the high correlation. The weakest relation with overall satisfaction is the relationship with responsiveness. It is the lowest correlation of all scatterplots. In the scatterplots shown there are no negative relations. This means that the correlation between all sub dimensions and overall satisfaction is positive. When the grade of the sub dimension goes up, the overall satisfaction also grows.
Figure 2: scatterplots showing the relations between overall satisfaction and its sub dimensions
Overall statisfaction - Music: Correlation; 0,65655
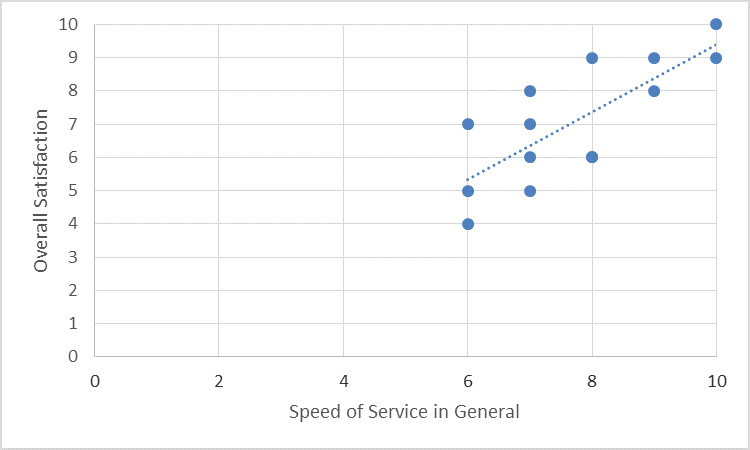
Overall satisfaction - Speed of service: Correlation; 0,77406
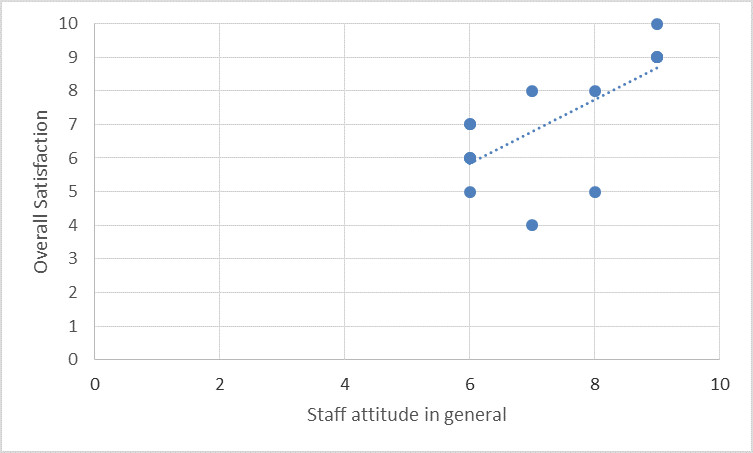
Overall satisfaction - Staff attitude: Correlation; 0,69320
Overall satisfaction - Responsiveness: Correlation; 0,60622
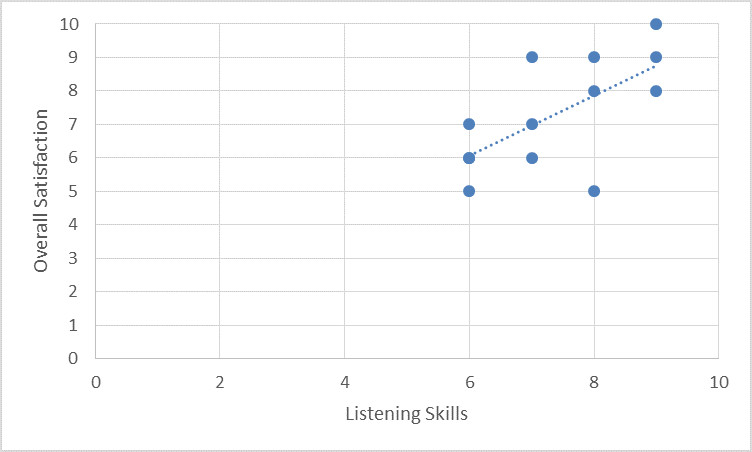
Overall satisfaction - Listening Skills: Correlation; 0,65360
Overall satisfaction - Knowledge: Correlation; 0,80874
Discussion
Research questions
How was the overall satisfaction rated?
The overall satisfaction had a 7 as average, as can be viewed in table 4. De Lachende Koe scored the best, while Pannenkoekenschip was rated as lowest.
How was the speed of service in general rated in restaurants in Leeuwarden?
Speed of service has an average score of 8 out of 10, according to table 4. De Lachende Koe was ranked at best, while Pannenkoekenschip again scored lowest.
What was the score for attitude in the restaurants in Leeuwarden?
Table 4 shows that the attitude was graded a 7 as average. De Lachende Koe scored best on this sub dimension too, while Mauritshuis was graded lowest on attitude.
Which dimension of staff quality has the strongest relation or influence on overall satisfaction?
As described in results, overall satisfaction has the strongest relation with knowledge. When knowledge increases by grade, the overall satisfaction increases too. This is shown by the correlation 0,80874, which is the highest correlation of all the scatterplots.
Problem statement
What is the level of staff quality in restaurants in Leeuwarden?
The level of staff quality in restaurants in Leeuwarden is high, graded with an average of 7 on overall satisfaction. This means that the researchers found that the staff was skilled and had a nice attitude. The overall satisfaction was the highest at de Lachende Koe and the lowest at Pannenkoekenschip.
Limitations
There were different limitations during this research and composing this research report. First of all there was no or not many freedom, the guidelines were already set by the teacher. Next to that the choices for the restaurants were limited, because they had to be service oriented, which does not include fast food restaurants and cafés for example McDonalds and Subway. Thirdly since guidelines were provided weekly, progress was slower than it could be and there were no options to do work in advance.
Recommendations
For the next time it would be wise to investigate the restaurant before the actual visit, because experiences of others can be compared to own actual experiences then. Also when looking into the company in advance, more suitable research questions can be established.
Moreover it would be wise if every group visited the same restaurant, in this way more experiences are gathered and more suitable recommendations can be made.
For the restaurant a recommendation is to decrease the service times. Although the staff was fast and the service times low, it created a feeling of them being in a rush. While the researchers wanted more rest to observe every aspect properly.
Reference list
Andersson, T. A. & Mossberg, L. (2004). The dining experience: do restaurants satisfy customer needs?Food Service Techonology.,4, 171-177.School of Economics, Sweden.
Pettijohn, C. E., Pettijohn, L. S. & Taylor, A. J. (2004). The Relationships Between Food Service Wait Staff Skills, Satisfaction, Commitment and Their Levels of Customer Orientation. International Journal of Hospitality & Tourism Administration, 5(2). 43-59. Retrieved from: www.haworthpress.com/web/IJHTA
Restaurants in Leeuwarden. (n.d.). Retrieved May 30, 2016, from www.tripadvisor.co.uk/Restaurants-g188563-Leeuwarden_Friesland_Province.html
Singh, H. (2015). Probing Service Quality in Restaurants: A Perceptual View of Customers. Global Journey of Multidisciplinary Studies., 4(12), 268-273. Retrieved from: www.gjms.com.in
Tobin, R. E. & Huffman, L. M. (2006). Examining the Impact of Service Times on Overall Guest Satisfaction Perception in the Casual Dining Environment.Review,24(1), 42-48.
Verhoeven, N. (2015).Doing Research; The hows and whys of applied research.Amsterdam: Boom Academic.
Appendices
Appendix: Observation checklist
Observation Checklist Restaurant Visit Guest Experience
Name of restaurant:
Student name: Group: dark blue 1 and dark blue 2
Gender: M / F
Nationality: Dutch / International
Please give a report mare for the items below.
1= very bad
6= satisfactory
10= excellent
The Checklist for restaurant visit to be filled out individually.
Item
Mark (1-10)
- Staff attitude in general
- Professionalism
- Honesty/trustworthiness
- Politeness
- Helpfulness
- Saying goodbye
- Enthusiasm
- Responsiveness
- Involvement
- Manners of staff
- Atmosphere
- Interior
- Music
- Other guests atmosphere
- Speed of Service in general
- Waiting time for being welcomed
- Waiting time for main course/food
- Waiting time for beverages
- Waiting time for being seated
- Waiting time for receiving bill
- Waiting time for check-back
- Knowledge about food
- Knowledge about beverages
- Skills of staff
- Serving skills
- Communication skills with guests
- Communication skills with colleagues
- Listening skills
- Entertaining skills
- Upselling skills
- Cross selling skills
- Hygiene in general
- Personal hygiene
- Neatness
- Grooming
- Wearing jewellery
- Hair dress
- Clothing
- Hygiene of facilities
- Creativity of food
- Presentation of food
- Food quality in general
- Overall satisfaction of the visit
- Total price per person
- Average Price of main course
Personal Essay
When doing research different aspects come to mind, the purpose of the research, choosing the research topic, reviewing literature, designing a problem statement and research questions, composing an instrument, the data collection process, the data analyzing and the conclusion and discussion. During the workshops and this whole module, we discovered how to compile a research report and what the different phases of research include. The sessions were very straight forward about the different procedures, however since this report was already so structured for us, it was hard to make any mistakes. The fact that guidelines were given was nice, except it would be a good experience to get more freedom, to do every step independently. With that said, this was a good way of showing us how research is done and how a research report is composed.
For our research we designed a questionnaire/checklist as observation instrument. A questionnaire according to Verhoeven (2015) should be comprehensive, easy to understand, clear, specific, not too long, usable and neutral. When a questionnaire does not match these factors, or when a questionnaire misses one/more of these aspects the researcher may developed a problem. Since the research process now has been made more difficult and an interview only can be done once. There is no option by doing it twice. Therefor the process of designing a questionnaire is long, and consists of deliberating, evaluating, scrapping and changing. I agree with Verhoeven on these statements, when having to create an observation checklist, the questions should be specific and clear, so every observant knows how to use and apply them. I also agree on the fact that observations in a specific restaurant (interviews) can only be done once, since experiences may differ per different visit. Staff is not always the same, in quantity, which persons are working that day and how they are behaving towards the guests.
When applying the statements made by Verhoeven to the research composed by me and my co-researchers, I think our questionnaire does not fully meet the standards set by Verhoeven. Our observation checklist fits most of the aspects, however some were left behind. The checklist was quit long, consisting of over 40 questions, which made that we had to observe a lot of different things at the same time. Also some of the subjects did not really fit the problem statement, this made the questionnaire too detailed. Still it covered all the subjects in all of the literature reviews, which makes that the checklist is comprehensive, covering all subjects mentioned.
Next to that the survey was clear, usable and neutral, since every team managed to fill it in for almost 100%. Not every aspect was applicable to each restaurant where observation were carried out, therefor some factors were not graded on the observation checklist by some of the groups. It was clear what aspects should be observed and how we should grade them. However when rating the different topics, there are two ways this can be done. First the observant can do this from own perspective and personal likes and dislikes. Secondly the observant can do this from a perspective of a researcher, staying objective. This is hard when doing research in a restaurant, since personal opinions easily influence grades given.
When doing research the next time, I think the questionnaire should be shortened, so the researchers can focus on specific points, instead of this many, which makes that every observant observed in a more global way. Next to that I also think we should have spent more time on composing the observation checklist, since we compiled it in less than an hour. We could have reviewed it another time, to be sure every item needed was in there and formulated in the right way. Nevertheless the checklist was clear, comprehensive, usable and neutral.
Photo gallery
Want to have your own Erasmus blog?
If you are experiencing living abroad, you're an avid traveller or want to promote the city where you live... create your own blog and share your adventures!
I want to create my Erasmus blog! →


Comments (0 comments)